
Rankings are based on independently published 0–60 mph tests currently included in the 0–60 Specs database. Vehicles without a qualifying published test in our database are not included.
Fastest Wagons: Top 0-60 Times
Median 0–60 mph 7.20sec Average 7.72s
Qualifying Vehicles 89 1963–2026 model years
Verified Tests 376 Tests in this category
01 /
Top 10 Fastest by 0–60 mph
- 1
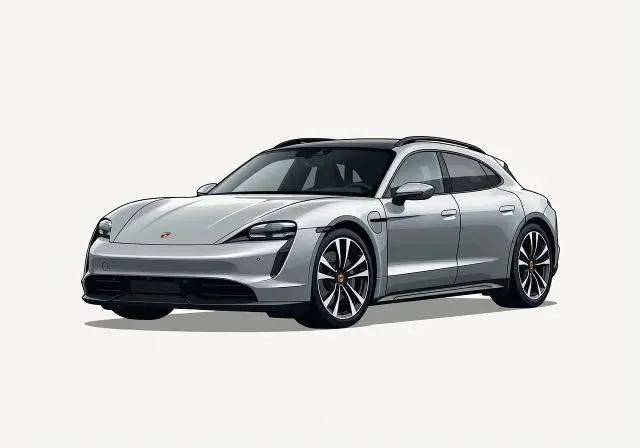 Porsche Taycan 2.20s
 - 2
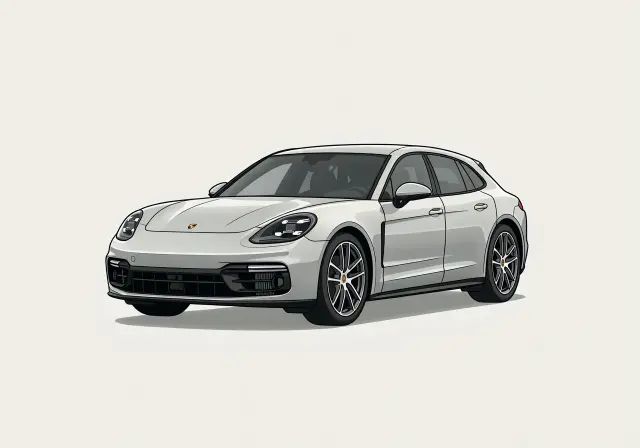 Porsche Panamera 2.70s
 - 3
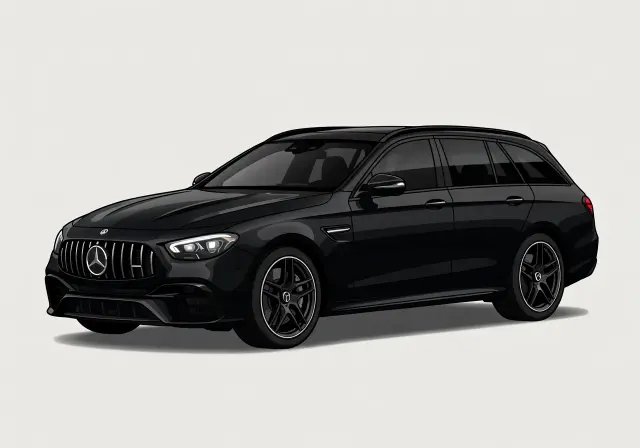 Mercedes-AMG E63 3.00s
 - 4
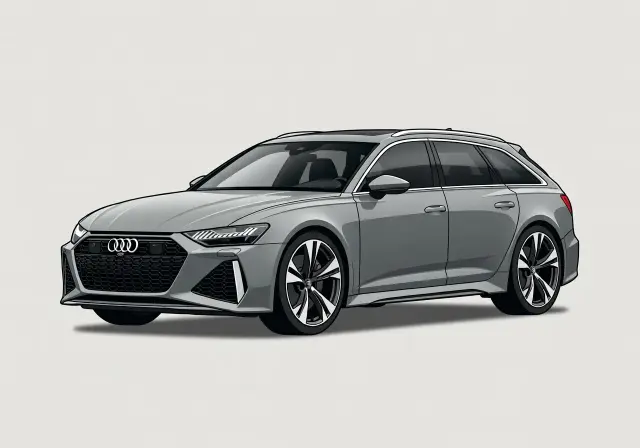 Audi RS 6 3.10s
 - 5
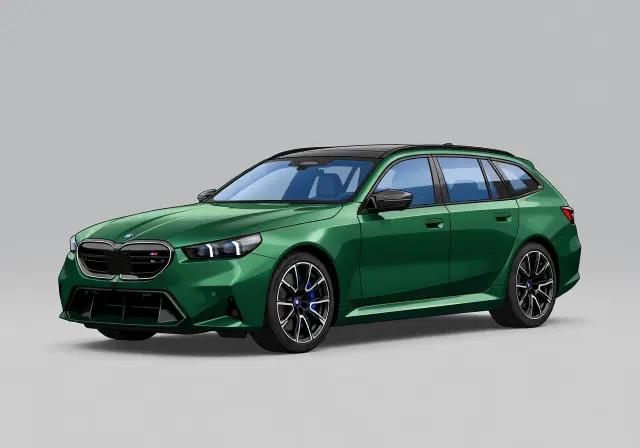 BMW M5 3.10s
 - 6
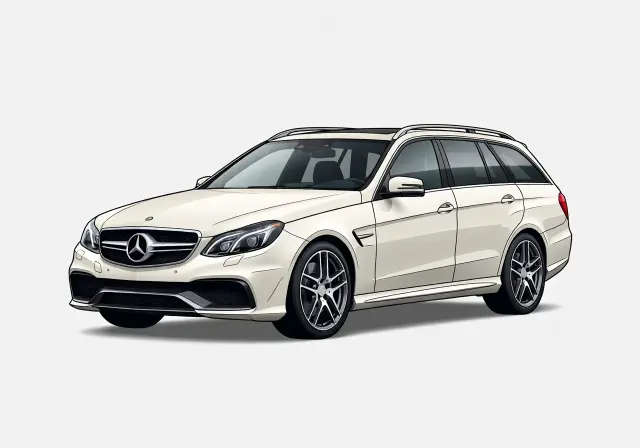 Mercedes-Benz E63 AMG 3.40s
 - 7
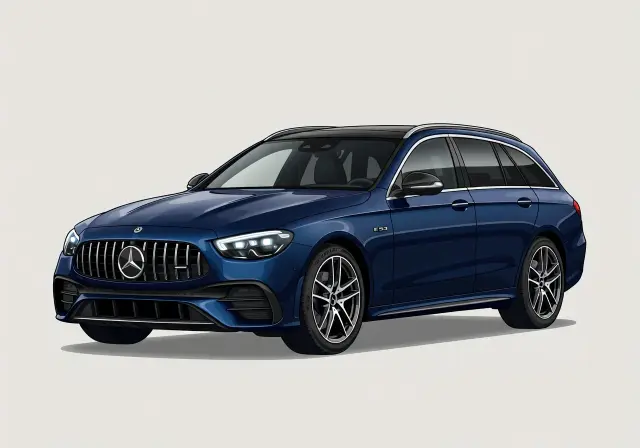 Mercedes-AMG E53 3.40s
 - 8
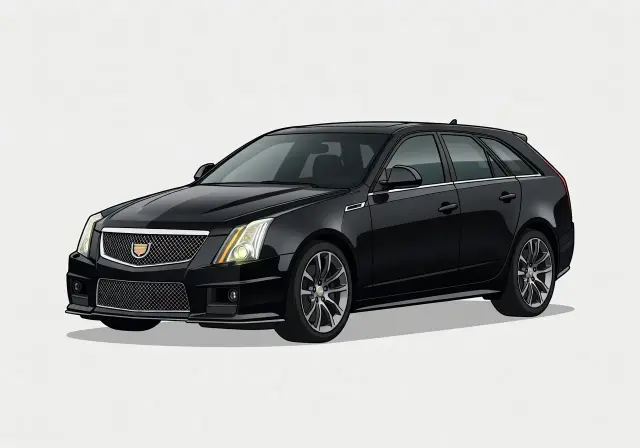 Cadillac CTS-V 3.90s
 - 9
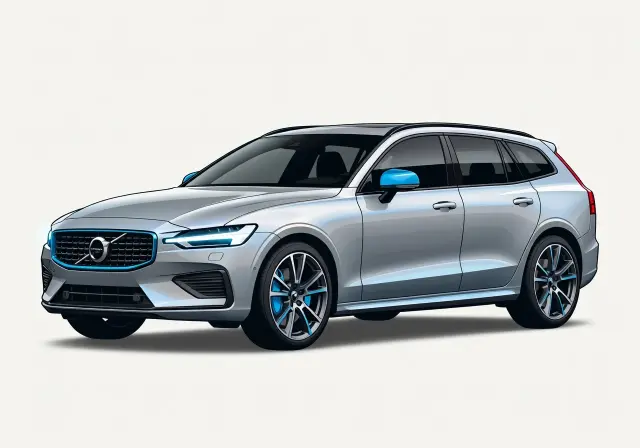 Volvo V60 4.00s
 - 10
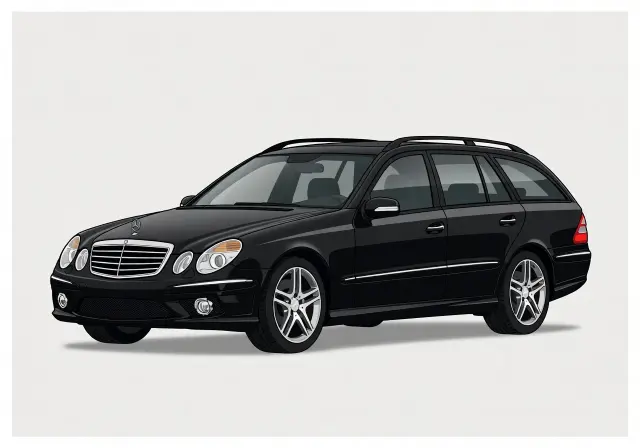 Mercedes-Benz E55 AMG 4.10s
02 /
Methodology & Eligibility
- Production-only by default. The canonical ranking counts factory-production vehicles. Use the toggle to include modified / tuner builds.
- One entry per model. Each model is represented by its single fastest verified result — repeated publication tests are collapsed.
- Ranked by 0–60 mph. Lower is faster; ties are broken by the earliest recorded test.
- Verified tests only. Every result comes from an independently published road test in our database.
03 /
Full Rankings
vehicles shown
04 /
Category Statistics
2.20sFastest 0–60 mph
7.20sMedian
7.72sAverage
22.10sSlowest qualifying
89Qualifying vehicles
Median is preferred over average — it is less influenced by a handful of exceptionally quick outliers. Statistics reflect production results only.
05 /
Common Traits Among the Fastest Wagons
This group of Wagons centers on all-weather traction and moderate mass. All-wheel drive accounts for 49 percent of the field, ahead of front-wheel drive at 34 percent and rear-wheel drive at 17 percent. Average output sits at 249 hp, with average torque at 255 and average weight at 3691 lb. The average power-to-weight figures are 64.7 hp per 1000 lb and 14.8 lb per hp.
The engine mix also explains the category's broad performance range. Naturally aspirated models make up 54 percent, turbocharged examples 31 percent, and manuals account for 30 percent. Most entries are gasoline powered at 88 percent, while hybrid, plug-in hybrid, electric, and diesel remain a small minority across the 1963 to 2026 spread.
17%Rear-wheel drive
49%All-wheel drive
34%Front-wheel drive
249 hpAvg horsepower
255 lb-ftAvg torque
3,691 lbAvg curb weight
64.8 hp/1,000 lbPower-to-weight
30%Manual gearbox
31%Turbocharged
2005Avg model year
06 /
Why Horsepower Isn't Everything
Horsepower sets the ceiling, but launch performance depends on more than output alone. In this field, the average Wagon makes 249 hp, yet the more useful context is the average 64.7 hp per 1000 lb, alongside an average weight of 3691 lb. That combination shows why lighter cars can stay close to more powerful ones.
Gearing, tire grip, and drivetrain layout matter just as much in 0-60 runs. A well-geared AWD wagon can convert its power more effectively off the line than a heavier or traction-limited rival, while some lighter manual or front-drive models outperform what their raw horsepower figure alone might suggest.
Horsepower vs 0–60 mph
One dot per vehicle · 89 plotted One dot per vehicle · 89 plotted
0s 5s 10s 15s 20s 0 200 400 600 800 1,000 Horsepower → 0–60 mph (seconds) →
0s 5s 10s 15s 20s 0 200 400 600 800 1,000 Horsepower → 0–60 mph (seconds) →
Top 10 ranked All other vehicles
Each dot is one vehicle at its fastest verified run. Exact figures for every point are in the full rankings.
07 /
Brands With the Most Wagons
08 /
Powertrain Breakdown
09 /
Wagons by Decade
The decade medians trace a steady acceleration trend. The 1960s sit at 22.1, improving to 14.4 in the 1970s, 10.2 in the 1980s, and 9.5 in the 1990s. By the 2000s, when the category also becomes much more populated, the median drops to 7.2.
That progress continues in newer eras. The 2010s median falls to 6.3, and the 2020s reach 4. This arc suggests wagons have benefited from better transmissions, broader AWD adoption, stronger forced-induction options, and newer electrified entries, even as average vehicle weight remains substantial.
10 /
Records & Superlatives
The category leaders show how much powertrain and traction shape results. The electric record belongs to the 2025 Porsche Taycan at 2.2, which also leads all-wheel drive and automatic entries. The quickest turbocharged wagon is the 2021 Porsche Panamera at 2.7, while the fastest naturally aspirated record is the 2005 Audi S4 at 5.7.
Drivetrain and transmission records reinforce that spread. Rear-wheel drive is led by the 2014 Cadillac CTS-V at 3.9, while front-wheel drive and manual are both topped by the 2009 MINI Cooper at 5.7. The CVT benchmark, a 2022 Subaru Outback at 5.8, shows how quickly the category stretches from EV launch capability to conventional layouts.
12 /
Frequently Asked Questions
What is the quickest wagon here?
The quickest entry is 2025 Porsche Taycan, and it reaches 60 mph in 2.2 seconds. It is a 2025 model, and its listed output is 938 hp, which helps explain why it sits at the top of this ranking.
How many wagons are included, and how wide is the performance range?
This ranking includes 89 Wagons. The spread runs from the category leader at 2.2 seconds to the slowest qualifying result at 22.1 seconds, so the field covers everything from highly optimized launches to much older or less performance-focused wagons.
What does typical 0-60 mph performance look like for wagons?
A typical result is best understood by the middle and average of the field. The median is 7.2 seconds, while the mean is 7.72 seconds. That tells you most wagons here are quick enough to feel responsive, even though only a smaller group approaches the record pace.
Why is the order based on 0-60 mph instead of horsepower?
Because 0–60 mph reflects the full launch result, not just engine output. Traction, gearing, curb weight, and drivetrain layout all affect the final number, so the ranking rewards the wagons that actually put power down most effectively in a standing start.
What qualifies a vehicle for this wagons ranking?
A vehicle qualifies by body style and by having a verified 0–60 mph result that fits this wagon category. Once included, each model is ordered by its recorded time, so the list compares like with like across different years, drivetrains, and powertrain types.