
Rankings are based on independently published 0–60 mph tests currently included in the 0–60 Specs database. Vehicles without a qualifying published test in our database are not included.
Fastest Cars Under 200 HP From 0–60 MPH
Median 0–60 mph 8.30sec Average 8.93s
Qualifying Vehicles 443 1949–2026 model years
Verified Tests 3,474 Tests in this category
01 /
Top 10 Fastest by 0–60 mph
- 1
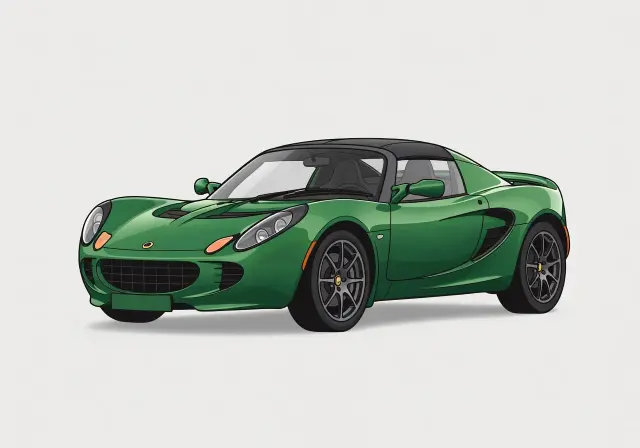 Lotus Elise 4.40s
 - 2
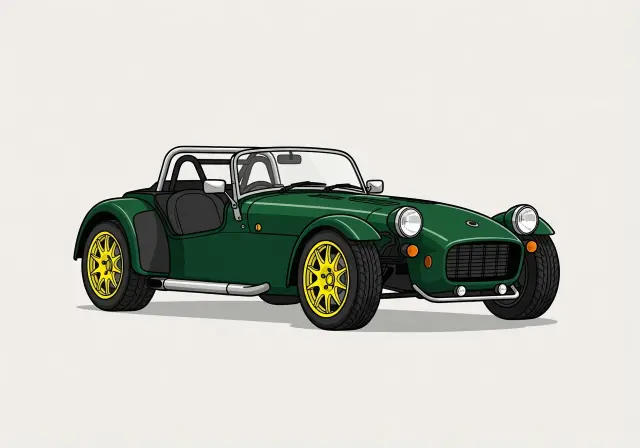 Caterham Seven 4.60s
 - 3
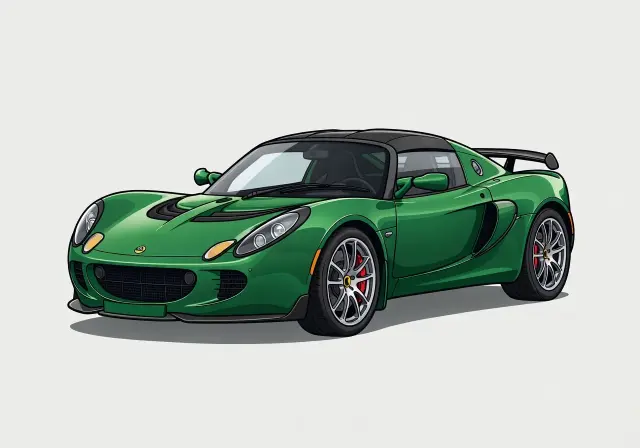 Lotus Exige 5.20s
 - 4
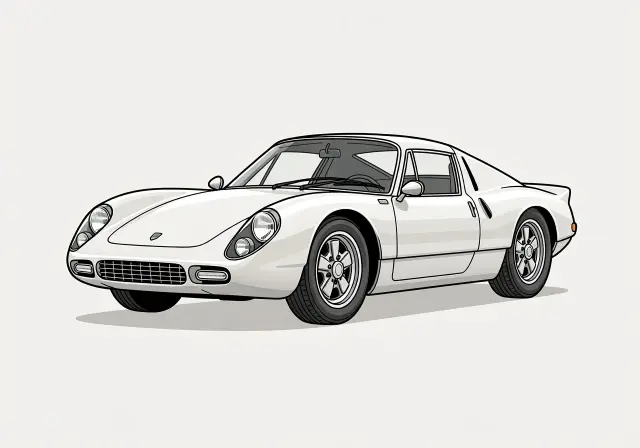 Porsche 904 5.30s
 - 5
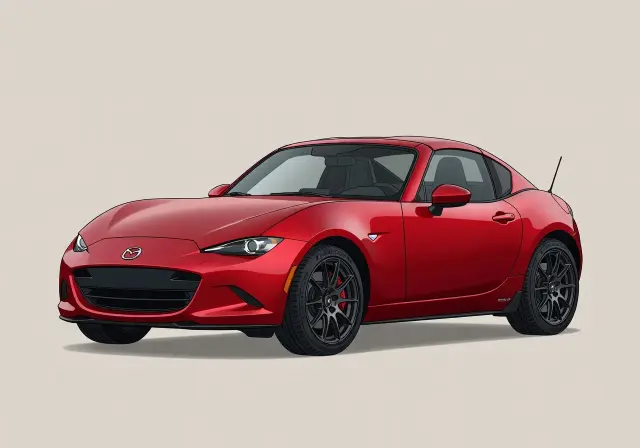 Mazda MX-5 Miata 5.40s
 - 6
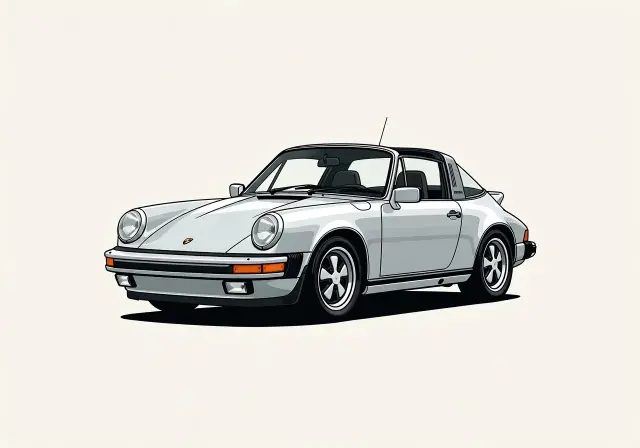 Porsche 911 5.50s
 - 7
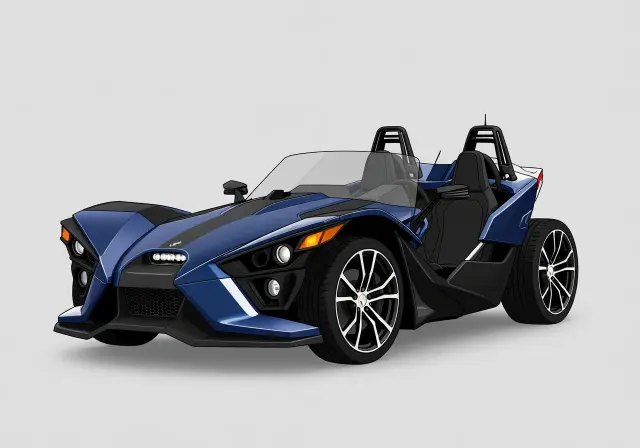 Polaris Slingshot 5.50s
 - 8
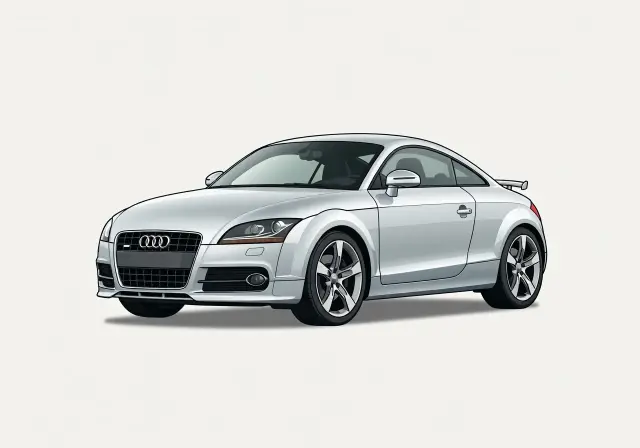 Audi TT 5.70s
 - 9
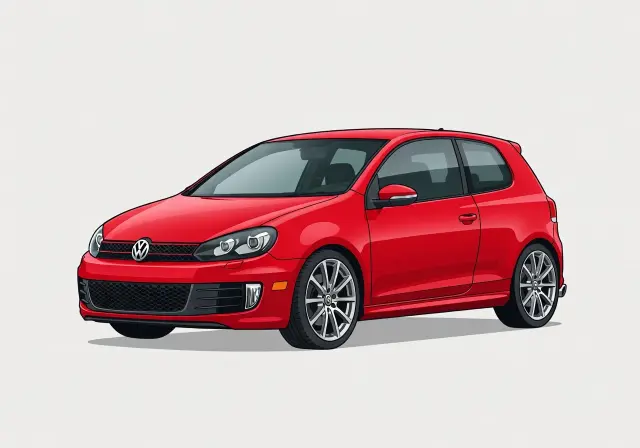 Volkswagen GTI 5.80s
 - 10
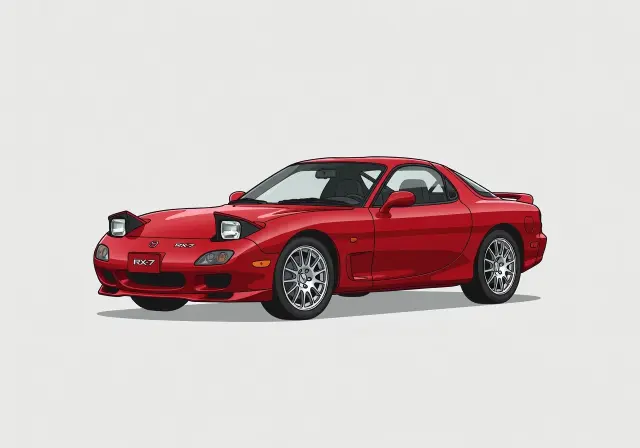 Mazda RX-7 6.00s
02 /
Methodology & Eligibility
- Production-only by default. The canonical ranking counts factory-production vehicles. Use the toggle to include modified / tuner builds.
- One entry per model. Each model is represented by its single fastest verified result — repeated publication tests are collapsed.
- Ranked by 0–60 mph. Lower is faster; ties are broken by the earliest recorded test.
- Verified tests only. Every result comes from an independently published road test in our database.
03 /
Full Rankings
vehicles shown
04 /
Category Statistics
4.40sFastest 0–60 mph
8.30sMedian
8.93sAverage
25.90sSlowest qualifying
443Qualifying vehicles
Median is preferred over average — it is less influenced by a handful of exceptionally quick outliers. Statistics reflect production results only.
05 /
Common Traits Among the Fastest Cars Under 200 HP
This group is defined by moderate output and mainstream mass rather than big power. Across all 442 entries, average output is 156 hp and 175 lb-ft, with average weight at 3,138 lb and a median weight of 3,200 lb. The average power-to-weight figures are 50.3 hp per 1,000 lb and 20.1 lb per hp.
Front-wheel drive is the largest share at 49 percent, followed by rear-wheel drive at 31 percent and all-wheel drive at 20 percent, with one other layout listed. Naturally aspirated cars account for 70 percent, turbocharged models 21 percent, and 50 percent of the field uses a manual transmission.
31%Rear-wheel drive
20%All-wheel drive
49%Front-wheel drive
156 hpAvg horsepower
175 lb-ftAvg torque
3,139 lbAvg curb weight
50.3 hp/1,000 lbPower-to-weight
50%Manual gearbox
21%Turbocharged
1998Avg model year
06 /
Why Horsepower Isn't Everything
This ranking shows why horsepower alone does not settle 0-60 mph results. The group averages 156 hp, yet outcomes vary because acceleration depends on how much weight that power moves, how the gearing multiplies it, and how effectively the tires can apply it. The category average of 50.3 hp per 1,000 lb and 20.1 lb per hp is a better guide than output by itself.
Drivetrain also shapes launches, especially when traction is limited. A well-geared Lotus Elise, Caterham Seven, or Mazda MX-5 Miata can outrun heavier cars with similar output, while strong traction helps cars like the Audi TT convert limited power into a quicker start.
Horsepower vs 0–60 mph
One dot per vehicle · 443 plotted 320 of 443 vehicles, evenly sampled
5s 10s 15s 20s 25s 50 100 150 200 Horsepower → 0–60 mph (seconds) →
5s 10s 15s 20s 25s 50 100 150 200 Horsepower → 0–60 mph (seconds) →
Top 10 ranked All other vehicles
Each dot is one vehicle at its fastest verified run. Exact figures for every point are in the full rankings.
07 /
Brands With the Most Cars Under 200 HP
08 /
Powertrain Breakdown
09 /
Cars Under 200 HP by Decade
The decade medians show a long improvement trend, though not in a straight line. The 1940s median sits at 10 seconds, the 1950s at 14, and the 1960s at 14.1. The 1970s returned to 10, then the 1980s moved to 8.8 and the 1990s to 8.7.
Progress continued in newer eras. The 2000s median fell to 8.0, the 2010s to 7.8, and the 2020s to 7.5. In short, the typical under-200-hp car has become quicker over time, with the most consistent gains appearing from the 1980s onward.
10 /
Records & Superlatives
The record holders underline how varied the quick end of this category can be. The fastest naturally aspirated car is the 2004 Lotus Elise at 4.4 seconds, while the quickest turbocharged entry is the 2009 Audi TT at 5.7. The fastest electric model is the 2020 MINI Cooper at 6.0.
By layout and transmission, rear-wheel drive and manual are both led by the Elise at 4.4, all-wheel drive and automatic by the TT at 5.7, front-wheel drive by the 2010 Volkswagen GTI at 5.8, and CVT by the 2025 Honda Civic at 6.1. That spread shows packaging, traction, and gearing matter as much as aspiration type.
12 /
Frequently Asked Questions
What is the quickest car in this ranking?
The quickest entry is the 2004 Lotus Elise, specifically the Roadster, with a 0–60 mph time of 4.4 seconds. It does that while staying under the category cap at 190 hp, and it comes from the 2004 model year.
How many vehicles are included, and how wide is the performance range?
This ranking includes 443 qualifying vehicles. At the quick end, the benchmark is 4.4 seconds; the median sits at 8.3 seconds; the average is 8.93 seconds; and the slowest qualifying result extends to 25.9 seconds. That gives a broad view of how varied Cars Under 200 HP can be.
What does typical 0-60 mph performance look like for this category?
Most Cars Under 200 HP are not clustered near the record. The middle of the field is 8.3 seconds, while the mean is 8.93 seconds, so a typical result is better judged by those figures than by the single quickest car.
Why is the ranking sorted by 0-60 mph instead of horsepower?
Because horsepower alone does not tell you how quickly a car reaches 60 mph. The order reflects measured 0–60 mph performance, which captures the combined effect of weight, gearing, traction, and drivetrain rather than just engine output.
What qualifies a car for this list?
A vehicle must fit the Cars Under 200 HP category and have a recorded 0–60 mph result. Once it qualifies, placement is determined by that acceleration time, from the quickest result down to the slowest included entry at 25.9 seconds.