
Rankings are based on independently published 0–60 mph tests currently included in the 0–60 Specs database. Vehicles without a qualifying published test in our database are not included.
Fastest Cars Under 400 HP From 0–60 MPH
Median 0–60 mph 6.30sec Average 6.90s
Qualifying Vehicles 928 1949–2027 model years
Verified Tests 10,033 Tests in this category
01 /
Top 10 Fastest by 0–60 mph
- 1
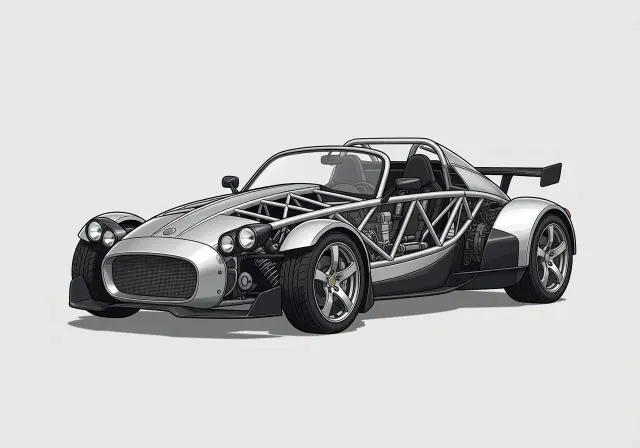 Ariel Atom 2.90s
 - 2
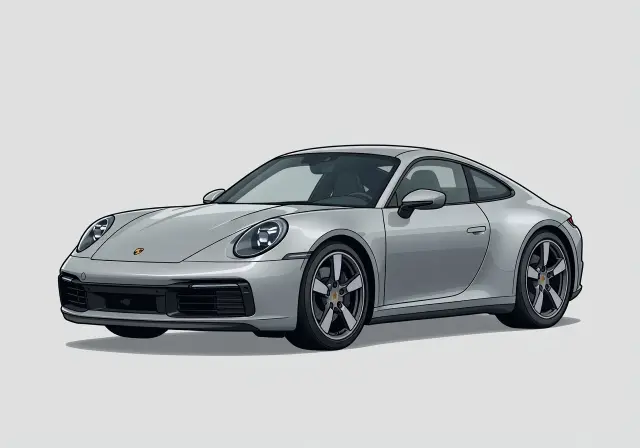 Porsche 911 3.10s
 - 3
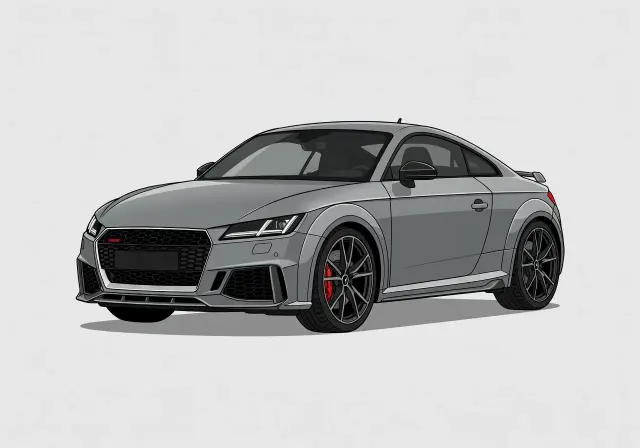 Audi TT 3.20s
 - 4
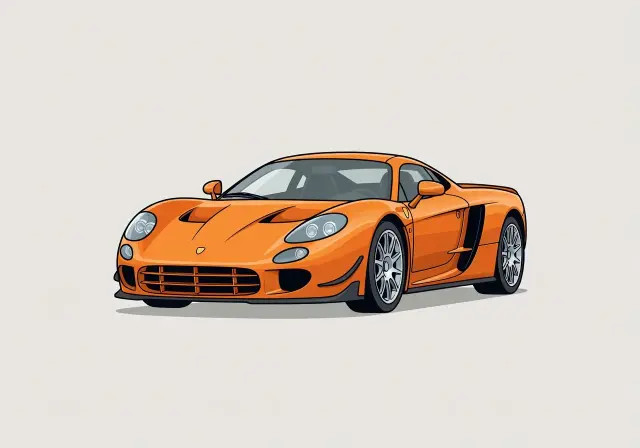 Noble M12 3.30s
 - 5
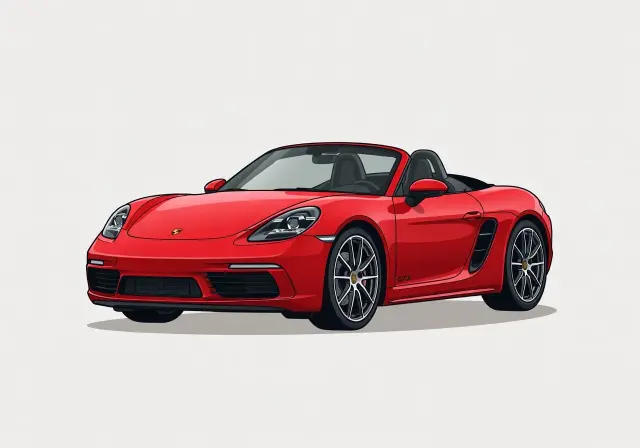 Porsche 718 Boxster 3.40s
 - 6
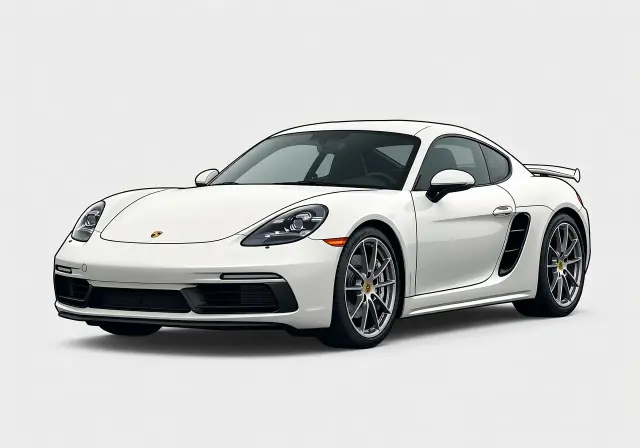 Porsche 718 Cayman 3.40s
 - 7
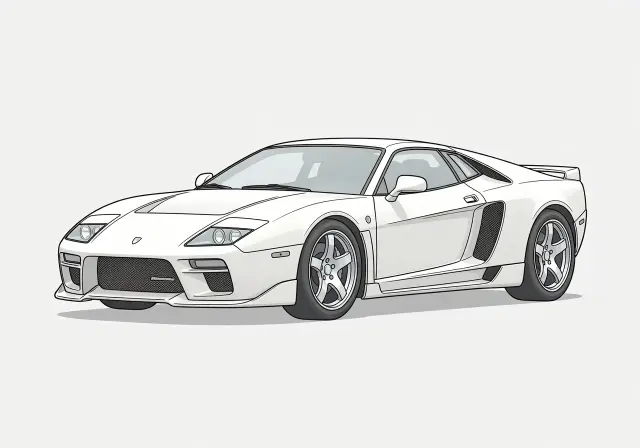 Mosler MT900 3.50s
 - 8
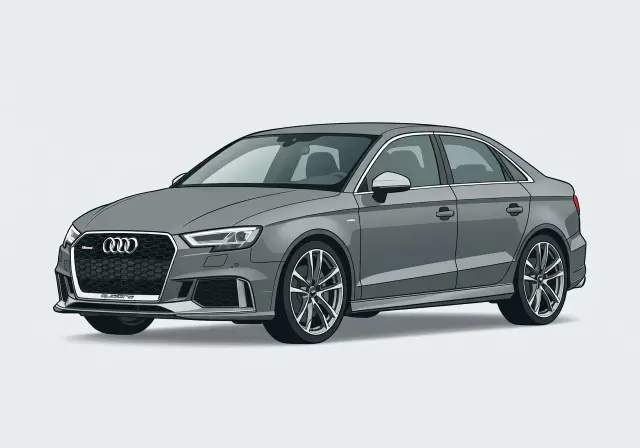 Audi RS 3 3.50s
 - 9
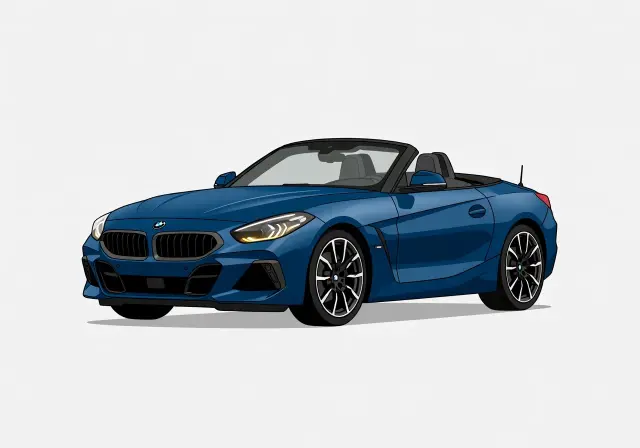 BMW Z4 3.50s
 - 10
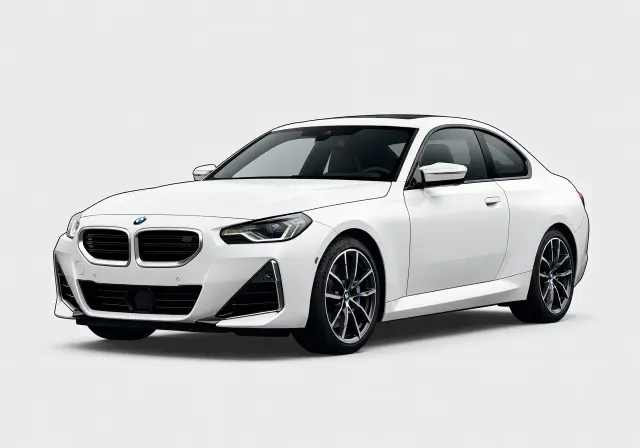 BMW M240i 3.60s
02 /
Methodology & Eligibility
- Production-only by default. The canonical ranking counts factory-production vehicles. Use the toggle to include modified / tuner builds.
- One entry per model. Each model is represented by its single fastest verified result — repeated publication tests are collapsed.
- Ranked by 0–60 mph. Lower is faster; ties are broken by the earliest recorded test.
- Verified tests only. Every result comes from an independently published road test in our database.
03 /
Full Rankings
vehicles shown
04 /
Category Statistics
2.90sFastest 0–60 mph
6.30sMedian
6.90sAverage
25.90sSlowest qualifying
928Qualifying vehicles
Median is preferred over average — it is less influenced by a handful of exceptionally quick outliers. Statistics reflect production results only.
05 /
Common Traits Among the Fastest Cars Under 400 HP
This group spans 921 vehicles from 1949 to 2026, with an average model year of 2005. Rear-wheel drive accounts for 39 percent, all-wheel drive 38 percent, and front-wheel drive 23 percent, so the field is split almost evenly between RWD and AWD. Average output is 259 hp and 274 lb-ft, while average weight is 3754 lb and median weight is 3700 lb.
On average, these cars carry 69 hp per 1000 lb, or 14.5 lb per hp. Naturally aspirated models make up 55 percent and turbocharged models 29 percent, with 32 percent equipped with a manual transmission. Gasoline power dominates at 85 percent, but electric, hybrid, plug-in hybrid, diesel, and hydrogen entries are also represented.
39%Rear-wheel drive
38%All-wheel drive
23%Front-wheel drive
260 hpAvg horsepower
275 lb-ftAvg torque
3,762 lbAvg curb weight
69 hp/1,000 lbPower-to-weight
32%Manual gearbox
29%Turbocharged
2005Avg model year
06 /
Why Horsepower Isn't Everything
Acceleration here is shaped by more than peak output. The average car in this ranking makes 259 hp, yet the group average also reflects 69 hp per 1000 lb and 14.5 lb per hp, showing why mass matters as much as engine rating. A lighter car, or one with shorter gearing, can outrun a heavier rival with a larger headline number.
Tires and drivetrain also change how effectively power reaches the pavement. With AWD at 38 percent and RWD at 39 percent, traction is a major part of the story, especially off the line. That is why well-geared, lightweight models such as the 2009 Ariel Atom can punch above their power in this field.
Horsepower vs 0–60 mph
One dot per vehicle · 928 plotted 320 of 928 vehicles, evenly sampled
5s 10s 15s 20s 25s 0 100 200 300 400 Horsepower → 0–60 mph (seconds) →
5s 10s 15s 20s 25s 0 100 200 300 400 Horsepower → 0–60 mph (seconds) →
Top 10 ranked All other vehicles
Each dot is one vehicle at its fastest verified run. Exact figures for every point are in the full rankings.
07 /
Brands With the Most Cars Under 400 HP
08 /
Powertrain Breakdown
09 /
Cars Under 400 HP by Decade
The decade medians show a clear long-term improvement in launch performance. The 1940s sit at 10 seconds and the 1950s at 10.2, before the 1960s drop to 8.2. The 1970s move back to 9.8, then the 1980s recover to 8.5 and the 1990s fall further to 7.3.
The biggest concentration of modern entries also brings the quickest typical times. The 2000s median is 6.3, the 2010s reaches 6, and the 2020s improves again to 5.4. Across this category, the pattern is that newer cars consistently deliver quicker 0-60 mph results than earlier decades.
10 /
Records & Superlatives
The record table shows several paths to quick launches under this cap. The fastest naturally aspirated entry is the 2022 Porsche 718 Boxster at 3.4 seconds, while the turbocharged leader is the 2025 Porsche 911 at 3.1. Electric pace is represented by the 2010 Tesla Roadster at 3.7.
By drivetrain and transmission, the spread is just as telling. Rear-wheel drive and manual records are both held by the 2009 Ariel Atom at 2.9, AWD is led by the 2018 Audi TT at 3.2, and front-wheel drive trails with the 2025 Hyundai Elantra at 4.7. That range shows traction, layout, and transmission choice matter as much as aspiration type.
12 /
Frequently Asked Questions
What is the quickest car in this ranking?
The quickest entry is the 2009 Ariel Atom, specifically the 3 Roadster, with a 0–60 mph time of 2.9 seconds. It shows that this group can reach supercar-level launch performance even while staying below 300 hp.
How many cars qualify, and how wide is the performance spread?
There are 928 Cars Under 400 HP in this ranking. The field runs from the record-setting 2.9 seconds at the top to 25.9 seconds at the bottom, so it covers everything from very quick specialty models to much more ordinary performers.
What is a typical 0-60 mph time for cars under 400 hp?
A good snapshot of typical performance is the 6.3 seconds median and 6.9 seconds average. That tells you most Cars Under 400 HP are quick enough to feel strong in everyday driving, even if only a smaller share approaches the category-leading pace.
Why are some lower-power cars ranked ahead of more powerful ones?
The ranking is ordered by 0–60 mph, not by output alone. A car with less power can place higher if it launches harder, weighs less, or uses its gearing and drivetrain more effectively than a heavier or traction-limited rival.
What qualifies a vehicle for this list?
To appear here, a vehicle has to fit the Cars Under 400 HP category and have a recorded 0–60 mph result. That means the list is defined by the horsepower cap and measured acceleration, not by body style, brand, or powertrain type.