
Rankings are based on independently published 0–60 mph tests currently included in the 0–60 Specs database. Vehicles without a qualifying published test in our database are not included.
Fastest Cars Over 1,000 HP From 0–60 MPH
Median 0–60 mph 2.20sec Average 2.32s
Qualifying Vehicles 13 2011–2026 model years
Verified Tests 43 Tests in this category
01 /
Top 10 Fastest by 0–60 mph
- 1
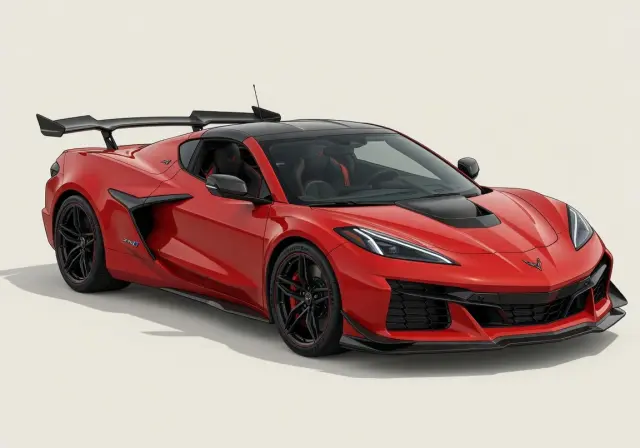 Chevrolet Corvette 1.80s
 - 2
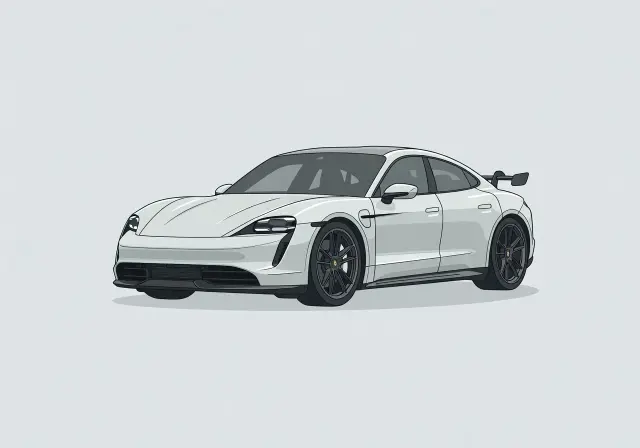 Porsche Taycan 1.89s
 - 3
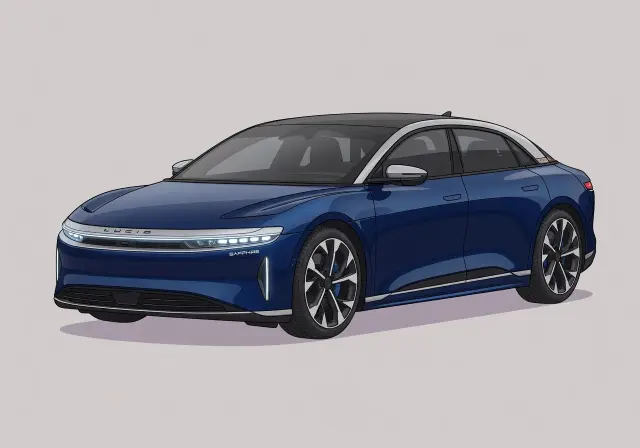 Lucid Air 1.90s
 - 4
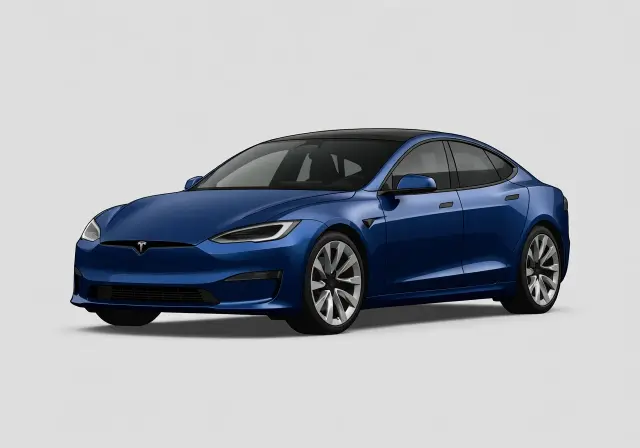 Tesla Model S 1.98s
 - 5
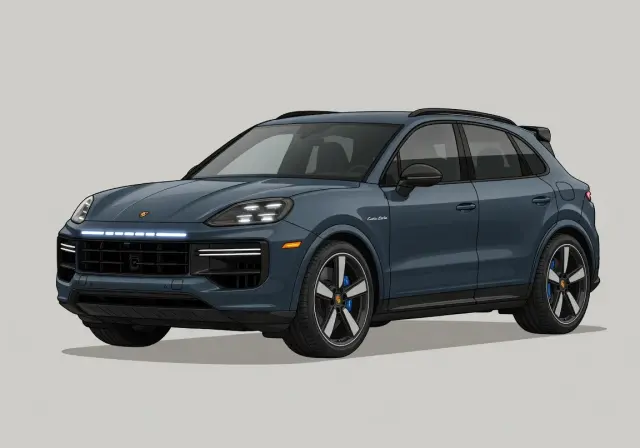 Porsche Cayenne 2.10s
 - 6
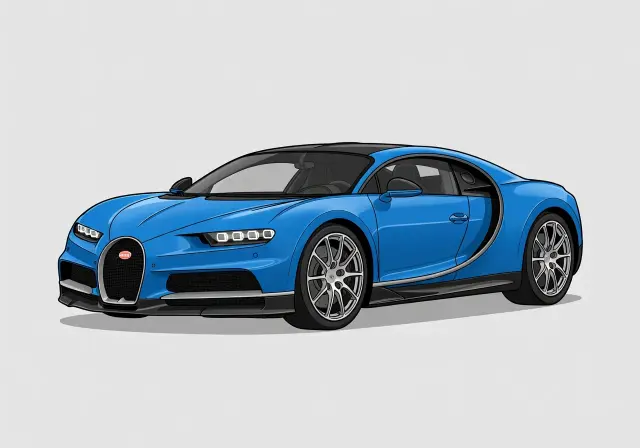 Bugatti Chiron 2.20s
 - 7
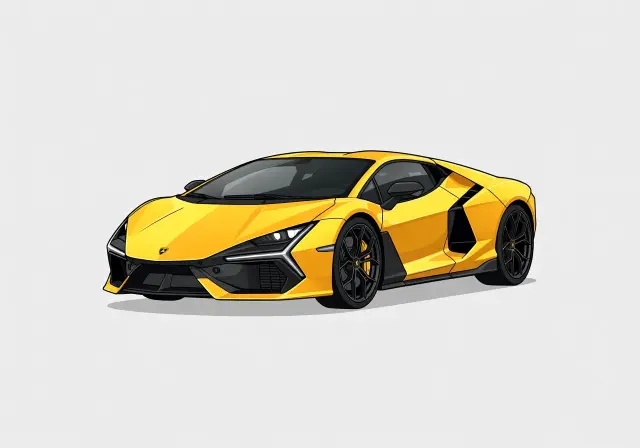 Lamborghini Revuelto 2.20s
 - 8
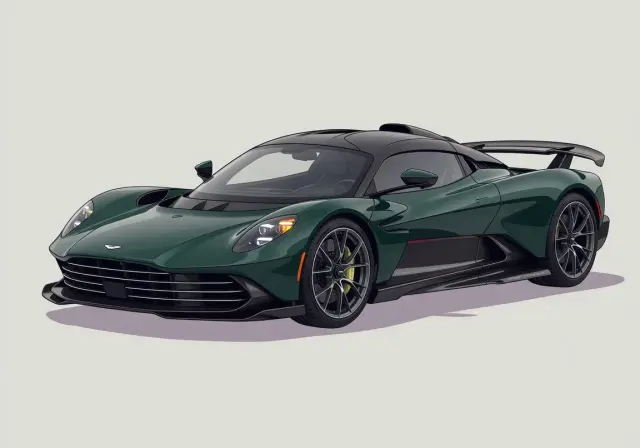 Aston Martin Valhalla 2.30s
 - 9
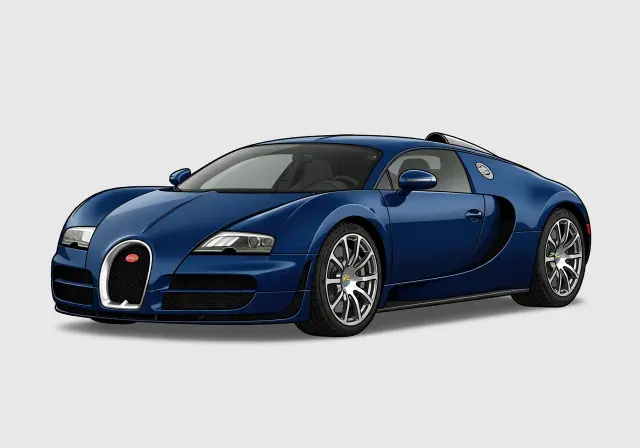 Bugatti Veyron 16.4 2.50s
 - 10
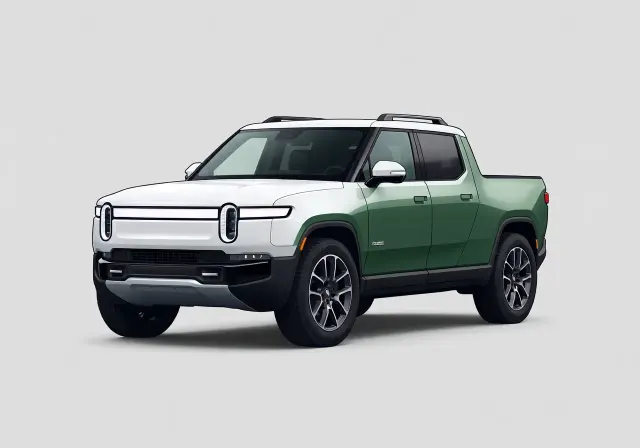 Rivian R1T 2.50s
02 /
Methodology & Eligibility
- Production-only by default. The canonical ranking counts factory-production vehicles. Use the toggle to include modified / tuner builds.
- One entry per model. Each model is represented by its single fastest verified result — repeated publication tests are collapsed.
- Ranked by 0–60 mph. Lower is faster; ties are broken by the earliest recorded test.
- Verified tests only. Every result comes from an independently published road test in our database.
03 /
Full Rankings
vehicles shown
04 /
Category Statistics
1.80sFastest 0–60 mph
2.20sMedian
2.32sAverage
3.20sSlowest qualifying
13Qualifying vehicles
Median is preferred over average — it is less influenced by a handful of exceptionally quick outliers. Statistics reflect production results only.
05 /
Common Traits Among the Fastest Cars Over 1000 HP
This group is defined as much by layout as by output. All-wheel drive accounts for 90% of the field and rear-wheel drive for 10%, with no front-wheel-drive entries and no manuals at all. Average output sits at 1117 hp and 1042 lb-ft, while average weight is 5703 lb and median weight is 4940 lb.
The powertrain mix also leans modern: Electric makes up 60%, gasoline 30%, and plug-in hybrid 10%. On average, these vehicles carry 214.1 hp per 1000 lb, or 5.1 lb per hp, which helps explain why models such as the 2025 Porsche Taycan and 2025 Lucid Air sit at the front.
0%Rear-wheel drive
100%All-wheel drive
0%Front-wheel drive
1133 hpAvg horsepower
1036 lb-ftAvg torque
5,638 lbAvg curb weight
217.4 hp/1,000 lbPower-to-weight
0%Manual gearbox
15%Turbocharged
2023Avg model year
06 /
Why Horsepower Isn't Everything
Raw output sets the ceiling, but it does not decide the order by itself. This field averages 1117 hp, yet the ranking still reflects differences in mass, gearing, tire grip, and how effectively each drivetrain can apply torque from a launch. That matters in a group with an average weight of 5703 lb and an average power-to-weight figure of 214.1 hp per 1000 lb.
The 90% AWD share shows how important traction is when four-digit power meets a standing start. It also helps explain why a lighter or better-geared entry can outperform a more powerful but heavier one, and why vehicles as different as the 2021 Tesla Model S and 2022 Bugatti Chiron land where they do.
Horsepower vs 0–60 mph
One dot per vehicle · 13 plotted One dot per vehicle · 13 plotted
2s 2.5s 3s 1,000 1,200 1,400 1,600 Horsepower → 0–60 mph (seconds) →
2s 2.5s 3s 1,000 1,200 1,400 1,600 Horsepower → 0–60 mph (seconds) →
Top 10 ranked All other vehicles
Each dot is one vehicle at its fastest verified run. Exact figures for every point are in the full rankings.
07 /
Brands With the Most Cars Over 1000 HP
08 /
Powertrain Breakdown
09 /
Cars Over 1000 HP by Decade
The decade view shows a clear step forward. The 2010s are represented by a median of 2.5, while the 2020s improve to a 2.2 median. In a category where the model-year average is 2023 and the range runs from 2011 to 2025, most of the quickest results are concentrated in recent vehicles.
That improvement tracks with the current makeup of the field: 60% electric, 90% all-wheel drive, and 0% manual. Vehicles such as the 2025 Rivian R1T and 2022 GMC Hummer EV also show that modern launch performance now extends beyond traditional low-slung supercar formats.
10 /
Records & Superlatives
The category records show distinct paths to quick launches. The fastest electric and all-wheel-drive and automatic entry is the 2025 Porsche Taycan at 1.89. The turbocharged benchmark is the 2022 Bugatti Chiron at 2.2, the hybrid mark belongs to the 2024 Lamborghini Revuelto at 2.2, and the rear-wheel-drive leader is the 2025 Chevrolet Corvette at 2.2.
The dual-clutch record-holder, the 2011 Bugatti Veyron 16.4, sits at 2.5. That spread from 1.89 to 2.5 shows how launch traction, power delivery, and transmission strategy separate very quick vehicles even when all of them clear the same four-digit horsepower threshold.
12 /
Frequently Asked Questions
Which vehicle is quickest in this ranking?
The quickest entry is the 2026 Chevrolet Corvette, specifically the ZR1X Targa Coupe (3LZ, Carbon Fiber Aero, ZTK Track Performance Pack), with a 0–60 mph time of 1.8 seconds. It is a 2026 model rated at 1,250 hp, and it sets the benchmark for this group.
How many vehicles qualify here, and how wide is the performance range?
There are 13 vehicles in this ranking. The quickest reaches 60 mph in 1.8 seconds, while the slowest qualifying result is 3.2 seconds, which shows that even the back of this field remains very quick by normal standards.
What is a typical 0-60 mph result for these cars?
A typical result sits around the middle of the pack at 2.2 seconds, while the overall average is 2.32 seconds. Looking at both figures helps show whether the field is tightly grouped or pulled by a few especially quick entries.
Why are some lower-ranked entries still over 1000 hp?
Because the order is based on 0–60 mph, not output alone. Cars with similar or even higher power can rank lower if they give up time at launch through extra weight, less effective traction, or gearing that is not as favorable off the line.
What qualifies a car for this list?
To appear here, a vehicle has to meet the over-1000-hp threshold and have a recorded 0–60 mph time. Once it qualifies, position is determined by acceleration time, so the fastest launch rises to the top regardless of body style or powertrain.