
Rankings are based on independently published quarter-mile tests currently included in the 0–60 Specs database. Vehicles without a qualifying published test in our database are not included.
Fastest All-Wheel-Drive Cars in the Quarter Mile
Median Quarter Mile
13.60sec
Average 13.60s
Qualifying Vehicles
509
1982–2027 model years
Average Trap Speed
104.2mph
Highest 161.0 mph · Bugatti Chiron
01 /
Top 10 Fastest by Quarter Mile
-
1
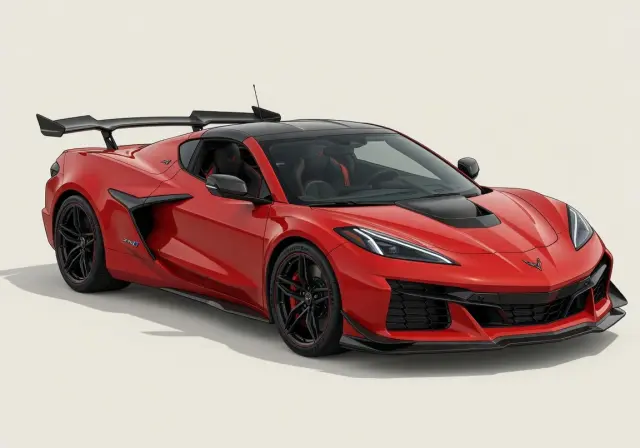 Chevrolet Corvette
8.90s155.0 mph
Chevrolet Corvette
8.90s155.0 mph
-
2
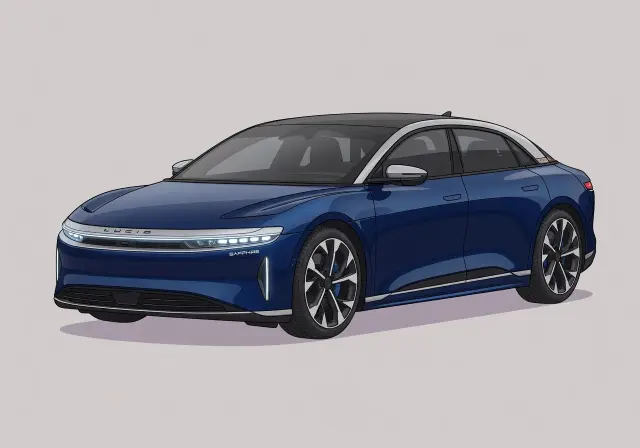 Lucid Air
9.00s154.8 mph
Lucid Air
9.00s154.8 mph
-
3
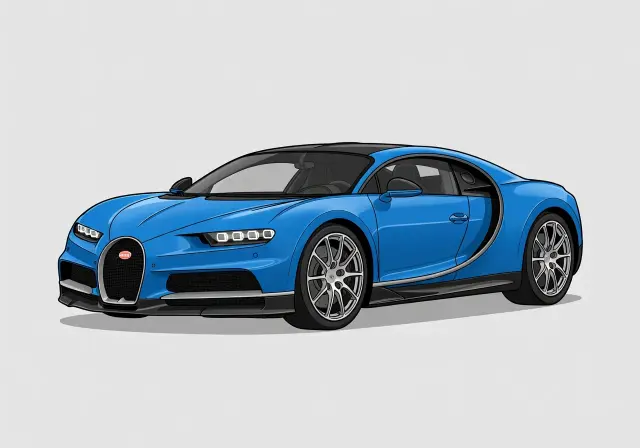 Bugatti Chiron
9.10s161.0 mph
Bugatti Chiron
9.10s161.0 mph
-
4
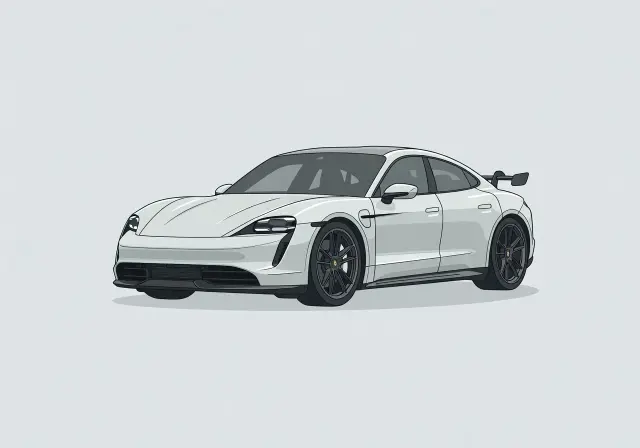 Porsche Taycan
9.20s150.1 mph
Porsche Taycan
9.20s150.1 mph
-
5
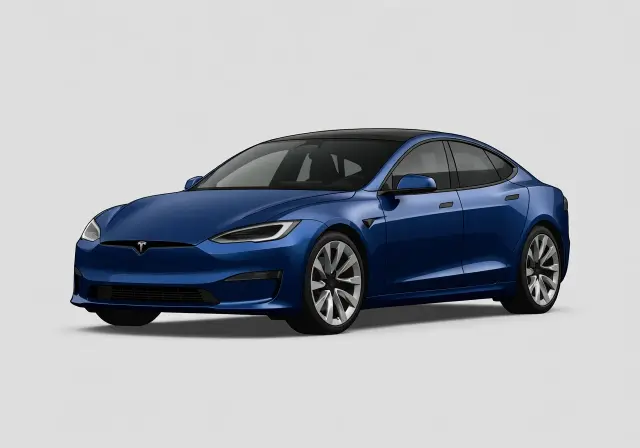 Tesla Model S
9.25s152.6 mph
Tesla Model S
9.25s152.6 mph
-
6
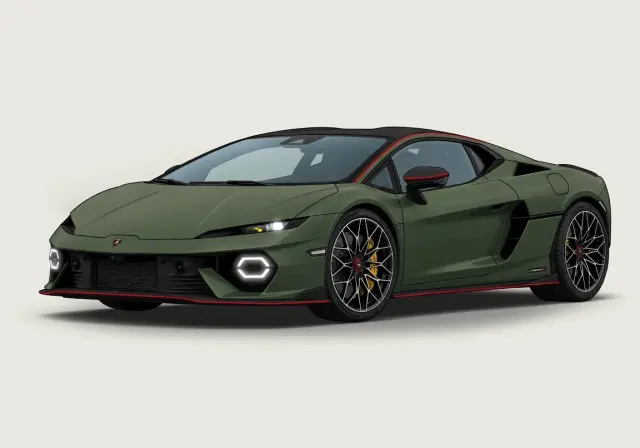 Lamborghini Temerario
9.40s150.0 mph
Lamborghini Temerario
9.40s150.0 mph
-
7
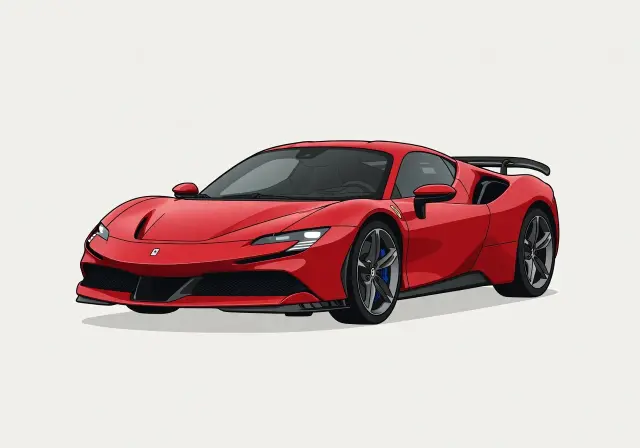 Ferrari SF90 Stradale
9.50s148.0 mph
Ferrari SF90 Stradale
9.50s148.0 mph
-
8
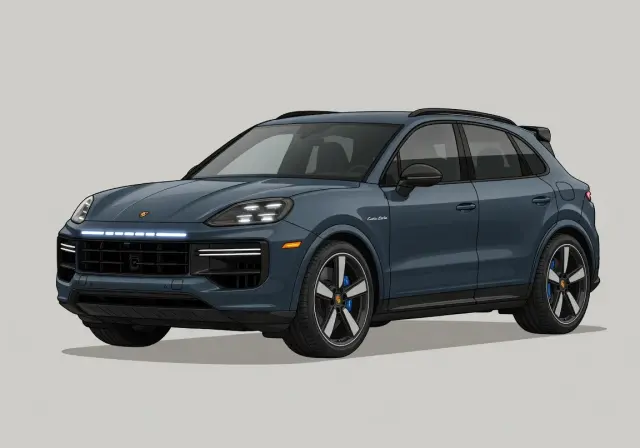 Porsche Cayenne
9.50s146.0 mph
Porsche Cayenne
9.50s146.0 mph
-
9
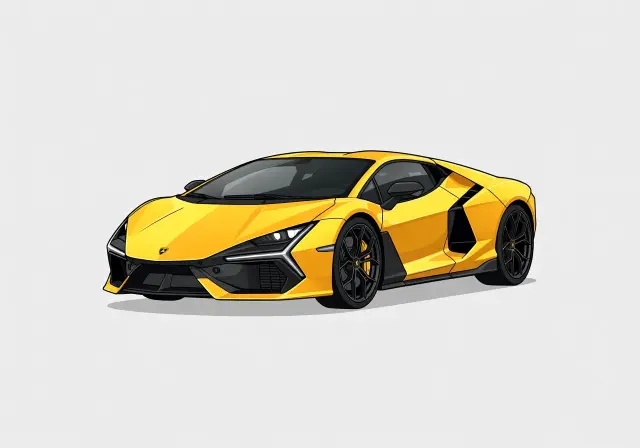 Lamborghini Revuelto
9.70s148.0 mph
Lamborghini Revuelto
9.70s148.0 mph
-
10
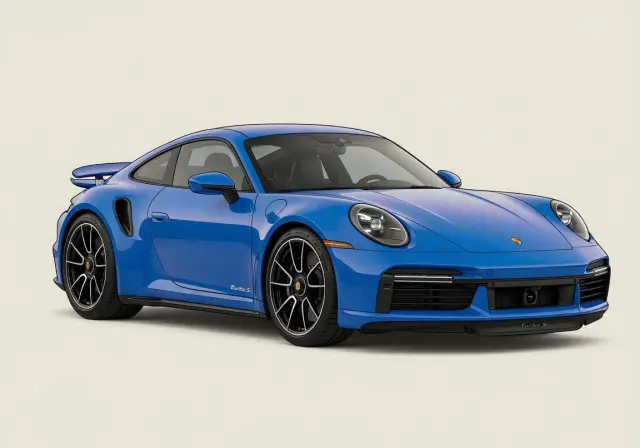 Porsche 911
9.70s142.0 mph
Porsche 911
9.70s142.0 mph
02 /
Methodology & Eligibility
- Production-only by default. The canonical ranking counts factory-production vehicles. Use the toggle to include modified / tuner builds.
- One entry per model. Each model is represented by its single fastest verified result — repeated publication tests are collapsed.
- Ranked by Quarter Mile. Lower is faster; ties are broken by the earliest recorded test. Elapsed time from a standing start over a quarter mile — trap speed is shown alongside it but does not affect the order.
- Verified tests only. Every result comes from an independently published road test in our database.
03 /
Full Rankings
vehicles shown
04 /
Category Statistics
8.90sFastest Quarter Mile
13.60sMedian
13.60sAverage
19.50sSlowest qualifying
509Qualifying vehicles
104.2 mphAverage trap speed
161.0 mphHighest trap speed
Median is preferred over average — it is less influenced by a handful of exceptionally quick outliers. Statistics reflect production results only. Trap speed is recorded as the car crosses the quarter-mile stripe and is reported for 504 of the 509 qualifying vehicles.
05 /
Common Traits Among the Fastest AWD Cars
Every entry here is all-wheel drive, with AWD accounting for 100 percent of the field and manual gearboxes appearing in 7 percent. As a group, these cars average 395 hp, 405 lb-ft, and 4434 lb, with 87.6 hp per 1000 lb or 11.2 lb per hp. The average quarter-mile trap speed is 104 mph.
The aspiration mix also helps explain the spread in results: 42 percent are turbocharged and 22 percent are naturally aspirated. The model years run from 1982 to 2027, averaging 2017, so this is a mostly modern set dominated by newer AWD performance hardware rather than older manual-era layouts.
0%Rear-wheel drive
100%All-wheel drive
0%Front-wheel drive
395 hpAvg horsepower
405 lb-ftAvg torque
4,434 lbAvg curb weight
87.6 hp/1,000 lbPower-to-weight
7%Manual gearbox
42%Turbocharged
2017Avg model year
06 /
What Decides a Quarter-Mile Time
Quarter-mile elapsed time depends on more than output alone. This group averages 395 hp, 87.6 hp per 1000 lb, and 11.2 lb per hp, and its average trap speed is 104 mph. That trap figure is a useful shorthand for power-to-weight because the car is still accelerating at the stripe.
But elapsed time also reflects how the run began. Launch quality, gearing, traction, and weight shape the first 60 feet, and the pass usually does not recover from a weak start. In other words, trap speed points harder at power-to-weight, while ET shows both the power available and how effectively the AWD system put it down early.
Horsepower vs Quarter Mile
One dot per vehicle · 504 plotted
320 of 504 vehicles, evenly sampled
10s
12.5s
15s
17.5s
20s
0
500
1,000
1,500
Horsepower →
Quarter Mile (seconds) →
10s
12.5s
15s
17.5s
20s
0
500
1,000
1,500
Horsepower →
Quarter Mile (seconds) →
Top 10 ranked
All other vehicles
Each dot is one vehicle at its fastest verified run. Exact figures for every point are in the full rankings.
07 /
Brands With the Most AWD Cars
08 /
Powertrain Breakdown
09 /
AWD Cars by Decade
The decade medians trace a clear improvement in quarter-mile performance. The 1980s sit at 16.5, the 1990s at 15.6, and the 2000s at 15. From there, the field moves more sharply forward, with a 13.7 median in the 2010s and 12.8 in the 2020s.
That progression matches the category's average model year of 2017 and shows how modern AWD systems, newer transmissions, and stronger powertrains have shifted the center of the field downward. Most of the list comes from the 2020s, and that decade also posts the quickest median quarter-mile result.
10 /
Records & Superlatives
The record holders show how different routes can arrive near the front. The fastest naturally aspirated car is the 2018 Lamborghini Huracan at 10.2 and 136 mph, the fastest turbocharged is the 2022 Bugatti Chiron at 9.1 and 161 mph, and the fastest electric is the 2025 Lucid Air at 9.0 and 154.8 mph.
Transmission and drivetrain records add the same lesson. The AWD and hybrid benchmark is the 2026 Chevrolet Corvette at 8.9 and 155 mph, while the automatic record-holder Chiron traps a higher 161 mph but does not post the quicker ET. That gap shows how a car can carry more speed through the lights yet still lose on elapsed time if the rest of the run was less efficient.
12 /
Frequently Asked Questions
What is the quickest quarter-mile time by an AWD car?
The current leader is 2026 Chevrolet Corvette, which covered the quarter mile in 8.9 seconds. It is the benchmark result in this field, and its run also sets the pace for what the very quickest AWD Cars can do over the quarter mile.
What trap speed did the fastest AWD car run?
The quickest car in this ranking, 2026 Chevrolet Corvette, crossed the quarter-mile at 155 mph. That matters because trap speed says a lot about how much power the car is carrying through the lights, while elapsed time also includes how well it launched.
How fast is a typical AWD car in the quarter mile?
Across 509 entries, the average result is 13.6 seconds and the median is 13.6 seconds. The field's average trap speed is 104.2 mph, which helps show the typical pace at the finish line rather than just the elapsed time.
How wide is the spread in AWD quarter-mile results?
This category ranges from 8.9 seconds at the front to 19.5 seconds at the back, covering 509 qualifying vehicles. That span shows how broad the AWD field is, from purpose-built performance models to much heavier and less powerful entries.
Why is this ranking ordered by quarter-mile time instead of trap speed?
The list is ranked by the result readers usually compare first: who covered the quarter mile in quickest. Trap speed still matters, but it measures a different part of the run. ET reflects the whole pass, including launch, traction, gearing, and how the car accelerated all the way through.