
Rankings are based on independently published 0–60 mph tests currently included in the 0–60 Specs database. Vehicles without a qualifying published test in our database are not included.
Fastest Turbocharged Cars From 0–60 MPH
Median 0–60 mph
6.20sec
Average 6.19s
Qualifying Vehicles
325
1974–2027 model years
Verified Tests
2,569
Tests in this category
01 /
Top 10 Fastest by 0–60 mph
-
1
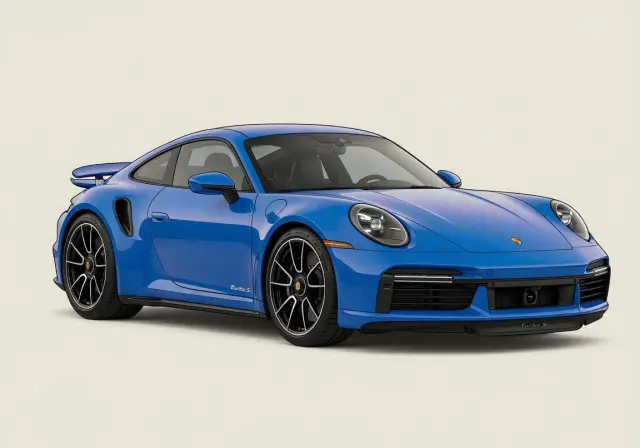 Porsche 911
2.15s
Porsche 911
2.15s
-
2
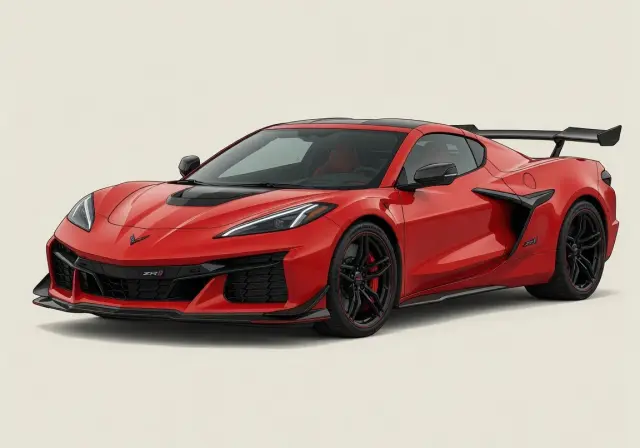 Chevrolet Corvette
2.53s
Chevrolet Corvette
2.53s
-
3
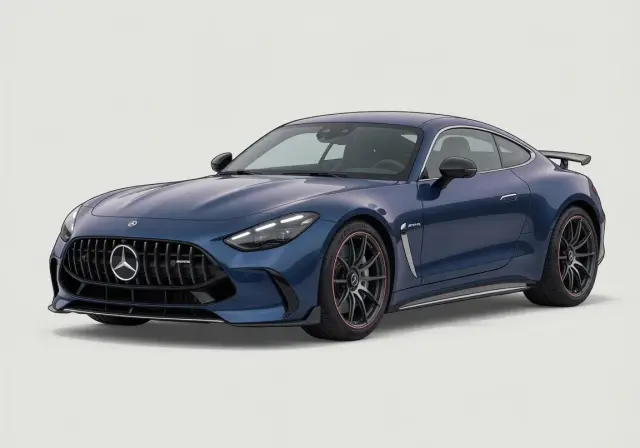 Mercedes-AMG GT63
2.80s
Mercedes-AMG GT63
2.80s
-
4
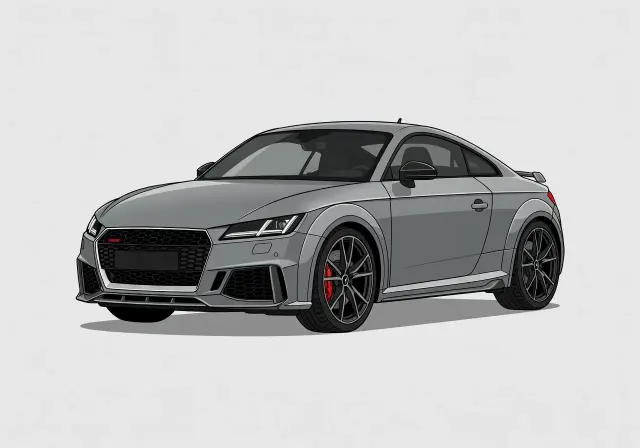 Audi TT
3.20s
Audi TT
3.20s
-
5
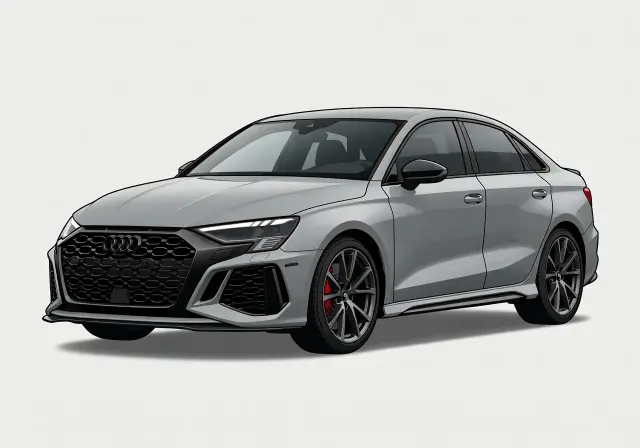 Audi RS 3
3.20s
Audi RS 3
3.20s
-
6
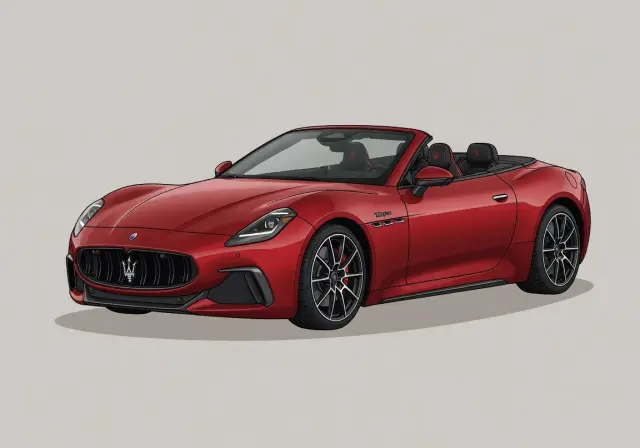 Maserati GranCabrio
3.40s
Maserati GranCabrio
3.40s
-
7
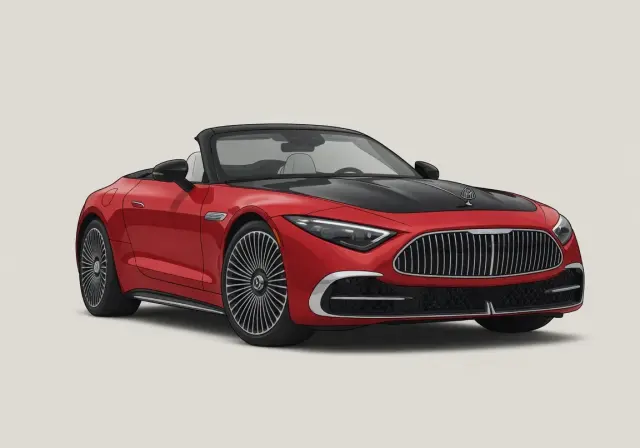 Mercedes-Maybach SL680
3.40s
Mercedes-Maybach SL680
3.40s
-
8
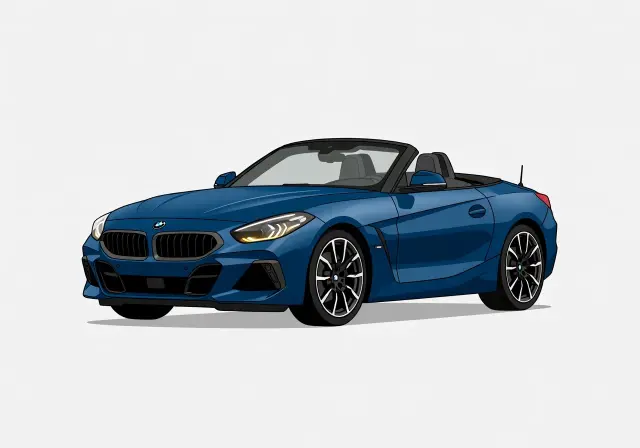 BMW Z4
3.50s
BMW Z4
3.50s
-
9
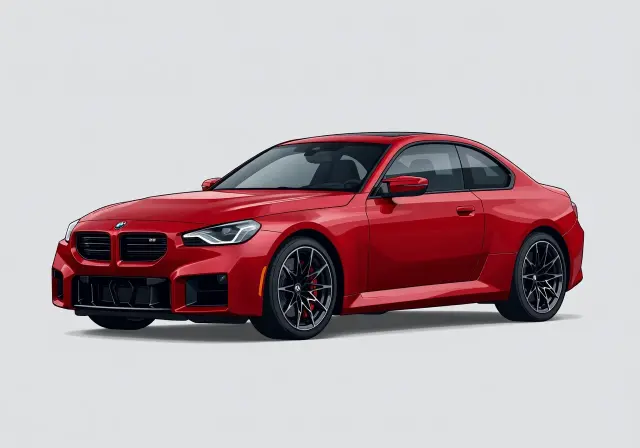 BMW M2
3.50s
BMW M2
3.50s
-
10
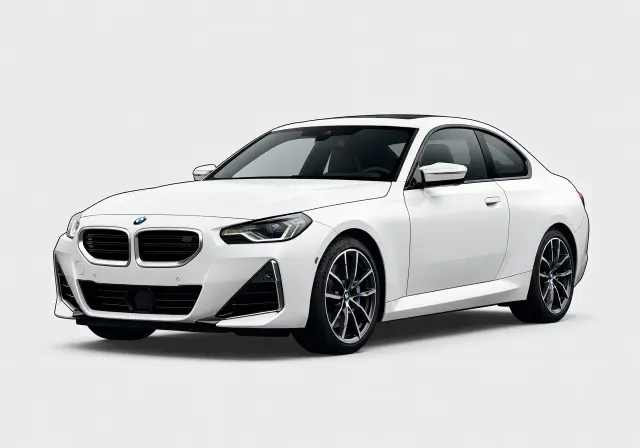 BMW M240i
3.60s
BMW M240i
3.60s
02 /
Methodology & Eligibility
- Production-only by default. The canonical ranking counts factory-production vehicles. Use the toggle to include modified / tuner builds.
- One entry per model. Each model is represented by its single fastest verified result — repeated publication tests are collapsed.
- Ranked by 0–60 mph. Lower is faster; ties are broken by the earliest recorded test.
- Verified tests only. Every result comes from an independently published road test in our database.
03 /
Full Rankings
vehicles shown
04 /
Category Statistics
2.15sFastest 0–60 mph
6.20sMedian
6.19sAverage
15.20sSlowest qualifying
325Qualifying vehicles
Median is preferred over average — it is less influenced by a handful of exceptionally quick outliers. Statistics reflect production results only.
05 /
Common Traits Among the Fastest Turbocharged Cars
This group is defined by turbocharging: 100 percent are turbocharged and 0 percent are naturally aspirated. All-wheel drive is the dominant layout at 59 percent, with rear-wheel drive and front-wheel drive each at 21 percent. Manuals account for 20 percent of the field, so most entries rely on other transmissions to deliver their quickest launches.
As a whole, these cars average 263 hp, 308 lb-ft, and 3892 lb, with a median weight of 3711 lb. Their average power-to-weight works out to 68.7 hp per 1000 lb, or 14.8 lb per hp. The mix is also mostly gasoline, led by brands such as BMW and Audi.
20%Rear-wheel drive
59%All-wheel drive
20%Front-wheel drive
269 hpAvg horsepower
312 lb-ftAvg torque
3,906 lbAvg curb weight
69.8 hp/1,000 lbPower-to-weight
19%Manual gearbox
100%Turbocharged
2014Avg model year
06 /
Why Horsepower Isn't Everything
Raw output matters, but this ranking shows why it is only part of the story. The average entry makes 263 hp, yet the group average also includes 3892 lb of mass and a power-to-weight figure of 68.7 hp per 1000 lb, or 14.8 lb per hp. That is why a lighter car or one with shorter gearing can outrun a heavier rival with more power.
Tires, launch calibration, and drivetrain traction also shape the first 60 mph. With 59 percent of the field using all-wheel drive, many of the quickest cars put torque down more effectively than rear- or front-drive alternatives. Models such as the 2009 KTM X-Bow show how low weight and favorable gearing can punch above headline horsepower.
Horsepower vs 0–60 mph
One dot per vehicle · 323 plotted
320 of 323 vehicles, evenly sampled
0s
5s
10s
15s
0
200
400
600
800
1,000
Horsepower →
0–60 mph (seconds) →
0s
5s
10s
15s
0
200
400
600
800
1,000
Horsepower →
0–60 mph (seconds) →
Top 10 ranked
All other vehicles
Each dot is one vehicle at its fastest verified run. Exact figures for every point are in the full rankings.
07 /
Brands With the Most Turbocharged Cars
08 /
Powertrain Breakdown
09 /
Turbocharged Cars by Decade
Median 0-60 mph performance has generally improved over time, though not in a perfectly straight line. The 1970s sit at 8.6 seconds, the 1980s improve to 7.5, and the 1990s fall to 6.2. The 2000s then move back to 6.5 before the 2010s settle at 6.3.
The 2020s currently lead with a 5.9-second median, making this the quickest decade in the set. That progression, across model years from 1974 to 2026, suggests stronger launch systems, broader all-wheel-drive adoption, and more effective turbo power delivery rather than a simple horsepower race alone.
10 /
Records & Superlatives
The record holders show how wide the category really is. The quickest turbocharged, hybrid, and all-wheel-drive entry is the 2026 Porsche 911 at 2.2 seconds, while the electric record belongs to the 2025 Audi SQ5 at 4.3. Among drivetrain leaders, rear-wheel drive is the 2023 BMW Z4 at 3.5 and front-wheel drive is the Hyundai Elantra at 4.7.
Transmission records reinforce the same point. The manual benchmark is the 2009 KTM X-Bow at 3.6, the automatic leader is the 2018 Audi TT at 3.2, the dual-clutch record is the Porsche Macan at 4.6, and the CVT best is the Nissan Altima at 5.8. The spread shows how layout and transmission can matter as much as engine type.
12 /
Frequently Asked Questions
Which model is quickest in this ranking?
The current leader is the 2026 Porsche 911, and its best recorded run to 60 mph is 2.15 seconds. It represents the fastest point in this category and sets the benchmark every other qualifying entry is measured against.
How many vehicles are included, and how broad is the performance range?
This ranking includes 325 qualifying entries. From top to bottom, the field stretches from the class-leading 2.15 seconds to the slowest qualifying result of 15.2 seconds, which shows how varied turbocharged cars can be within one acceleration category.
What is a typical 0-60 mph time for these cars?
A typical result is best understood through the middle and the average of the field. The median sits at 6.2 seconds, while the mean is 6.19 seconds, giving readers a useful sense of what most Turbocharged Cars deliver in real ranking terms.
Why is the list ordered by 0-60 mph instead of horsepower?
Because 0–60 mph captures the actual launch result, not just engine output. Weight, gearing, tires, and drivetrain traction can all change how effectively a car turns power into acceleration, so the ranking is based on measured performance rather than spec-sheet power alone.
What qualifies a vehicle for this category?
To appear here, a vehicle has to be one of the Turbocharged Cars and have a recorded 0–60 mph result. The page then ranks those qualifying entries by quickest time, so readers can compare the full field on one consistent acceleration measure.