
Chevrolet Tahoe vs Toyota Sequoia: 0–60 and Quarter-Mile Comparison
This comparison looks at verified acceleration results for the Chevrolet Tahoe and Toyota Sequoia, covering 0–60 mph times, quarter-mile times, and broader acceleration comparisons across tested model years. The available record set spans 35 tests for the Tahoe and 17 for the Sequoia, giving useful context for how these full-size SUVs have performed over time.
In production form, the Toyota Sequoia holds the quicker 0–60 mph result by 0.2 second, with a best verified 5.5-second run from the 2023 Platinum. Quarter-mile results favor the Chevrolet Tahoe by 0.1 second, led by the production 2018 Premier RST Performance Package at 14.1 seconds. The fastest overall 0–60 result here is the non-production, modified 2018 Callaway Tahoe at 4.8 seconds, while the Sequoia also leads the median 0–60 comparison.
The latest shared model year with verified data is 2025, and in that year the Sequoia is ahead in 0–60 mph by 0.1 second. Use the tables below to compare individual trims, sources, and test years in more detail, especially if you want to separate stock production results from modified outliers and see how quarter-mile performance differs from short-run acceleration.
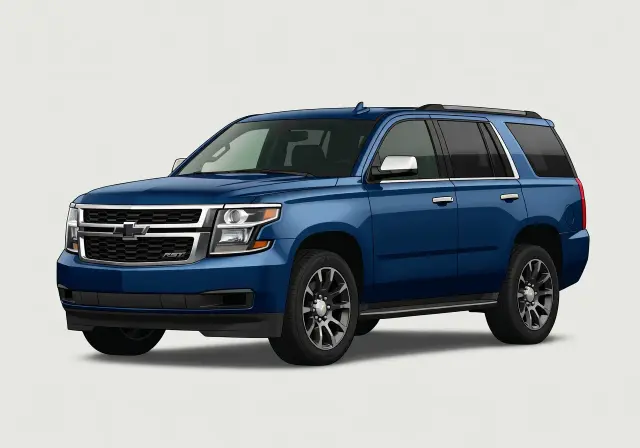
Tahoe Fastest 0–60 5.70sec 2018 Premier RST Performance Package
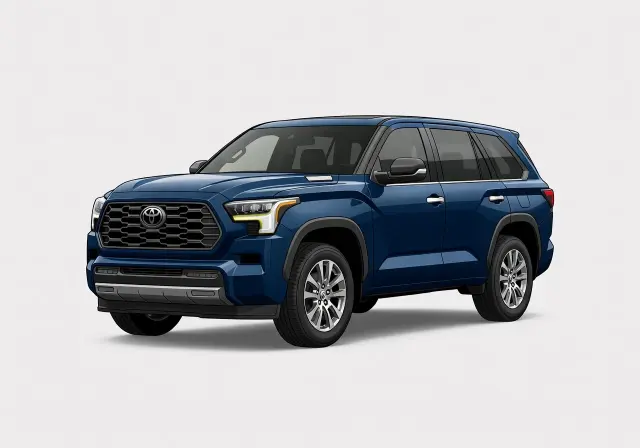
Sequoia Fastest 0–60 5.50sec 2023 Platinum
0–60 Winner Toyota Sequoia (0.20s faster)
Tests in Database 52 35 + 17
01 /
Category Winners: Tahoe vs Sequoia
Both models split the 6 categories evenly — 3 wins each — making this a closely contested comparison.
| Category | Chevrolet Tahoe | Toyota Sequoia |
|---|---|---|
| Fastest production 0–60 | 5.70s | 5.50s Winner |
| Fastest production ¼ mile | 14.10s Winner | 14.20s |
| Fastest overall 0–60 | 4.80s Winner | 5.50s |
| Fastest overall ¼ mile | 13.10s Winner | 14.20s |
| Median production 0–60 | 7.50s | 6.60s Winner |
| Median production ¼ mile | 15.70s | 15.20s Winner |
| Category wins | 3 | 3 |
02 /
All-Time Production Records
Production vehicles onlyThe Toyota Sequoia holds the production 0–60 record at 5.50s, 0.20s quicker than the Chevrolet Tahoe's best of 5.70s.
Fastest Production 0–60
Tahoe 5.70s 2018 · Premier RST Performance Package
Sequoia 5.50s 2023 · Platinum
0.20s difference Fastest Production ¼ Mile
Tahoe 14.10s 2018 · 100.0 mph
Sequoia 14.20s 2025 · 97.0 mph
0.10s difference 03 /
Fastest Overall Results
Includes modified and non-production vehiclesCounting all tests, the Chevrolet Tahoe has been clocked at 4.80s 0–60 — 0.70s quicker than the Toyota Sequoia's overall best of 5.50s.
Fastest Overall 0–60
Tahoe 4.80s 2018 · Callaway Premier RST SC560 modified
Sequoia 5.50s 2023 · Platinum
Fastest Overall ¼ Mile
Tahoe 13.10s 2018 · 107.0 mph modified
Sequoia 14.20s 2025 · 97.0 mph
04 /
Typical Production Performance
Medians and averages across all production testsOn a typical production run, the Toyota Sequoia reaches 60 mph in 6.60s — 0.90s quicker than the Chevrolet Tahoe's median of 7.50s.
| Metric | Chevrolet Tahoe | Toyota Sequoia |
|---|---|---|
| Median 0–60 | 7.50s | 6.60s |
| Average 0–60 | 7.55s | 6.90s |
| Median ¼ Mile | 15.70s | 15.20s |
| Average ¼ Mile | 15.72s | 15.27s |
| Sample (0–60) | 32 | 17 |
Median is preferred over average — it is less influenced by extreme outlier tests. Averages include all production runs on record.
06 /
Latest Available Results
| Metric | Chevrolet Tahoe | Toyota Sequoia |
|---|---|---|
| Latest tested year | 2025 | 2025 |
| Best 0–60 that year | 5.80s High Country | 5.70s 1794 Edition |
| Best ¼ mile that year | 14.30s | 14.20s |
07 /
Overlapping Model Years (2002–2025)
7 shared tested yearsRestricted to the 7 years both models overlapped (2002–2025), the Toyota Sequoia held a 0.86s median 0–60 advantage over the Chevrolet Tahoe.
Median 0–60 · 2002–2025 era only
Tahoe 7.25s 14 production runs
Sequoia 6.39s 14 production runs
08 /
Data Coverage
The Chevrolet Tahoe has 35 tests spanning 1996–2025, while the Toyota Sequoia has 17 tests from 2001–2025.
| Metric | Chevrolet Tahoe | Toyota Sequoia |
|---|---|---|
| Total tests | 35 | 17 |
| Production tests | 32 | 17 |
| Earliest tested year | 1996 | 2001 |
| Latest tested year | 2025 | 2025 |
09 /
Explore Each Model
10 /
Related Comparisons
All 0–60 and quarter-mile results are sourced from independently published road tests by reputable automotive publications. Manufacturer-claimed times are not included. When multiple publications test the same vehicle, each run is listed separately. Production and non-production results are clearly distinguished throughout. Fastest 0–60 and fastest quarter-mile records are treated as independent measurements and may come from different tests, trims, or sources.